Logging and Observability in .NET: Best Practices
Quick Summary:When you have strong .NET observability it turns the guesswork into a clear vision by revealing what your application is doing, why it’s doing and where it might fail next time. This blog will break down practical logging strategies and observability best practices that can scale with modern .NET systems. Lets learn how to reduce downtime, debug faster and make your application resilient with data you can trust.
Introduction
Modern .NET applications are no longer those simpler and single layered. Rather they are distributed, cloud native and developed with the help of Microservices, third party APIs and asynchronous workflow. Therefore, it is essential to monitor the application in these situations. Also you must be aware of why it is going wrong. This is certainly challenging without the right visibility. Hence it’s when .NET observability and logging comes to play a crucial role.
Logging and observability in .NET development services helps developers move towards reactive debugging and proactive system insight. Hence logging can capture what happened at a specific part in time, observability combines logs, metrics and traces for explaining how and why an application behaves in a certain manner. Hence altogether they provide the foundation for faster debugging, performance optimization, and reliable production approach.
Through this blog we will explore logging and observability best practices in .NET from a practical approach. You will also get to learn why logging is essential, how to implement it in the best way and which practices can enhance clarity, performance and security. Let’s get going towards the concepts.
Importance of .NET logging
Logging is one of the crucial aspects of a software development process but it is often not considered unless the whole program comes crashing. Logging fulfills plenty of roles such as root cause and bug analysis. It also analyzes the application’s performance. With the help of Microsoft’s .NET a developer can create multiple locations for log along with a flat file.
Moreover C# and VB.NET languages ensure internal libraries for a fresher. Although these are limited, along with them you can also get a free and easy to use framework with best working capacities. Additionally, you may control where messages are written thanks to its pluggable logging architecture, which is made possible by ILoggerProvider. When using the.NET framework, the first-party log providers include:
- Console provider that is helpful in writing logs for console.
- Debug providers that let you create logs for the debug window.
- EventLog provider for creating logs to the Window Event Log.
- EventSource Provider for logging using LTTng on Linux or Event Tracing on Windows.
Logging in .NET
If you don’t create a log in .NET application development, windows will still catch the issues and write the message to Windows Event Log. It can further read this with the help of the Event Viewer application. So why trouble yourself in logging? It serves plenty of other purposes. Additionally it also makes it easier for you to identify the bug due to customized error messages. It’s not a crucial thing if you are creating only a small application.
On the other hand if you want to create a complex application with multiple people working on it, logging is necessary. There are chances that you have to look for errors in the code that you didn’t create. Rather than working for hours to find only one error, right logging can help you point towards the exact piece of code and input that is causing trouble.
Avoid only depending on Windows Event Log hides critical context. It can make debugging complex issues harder.
Best practices for logging in .NET
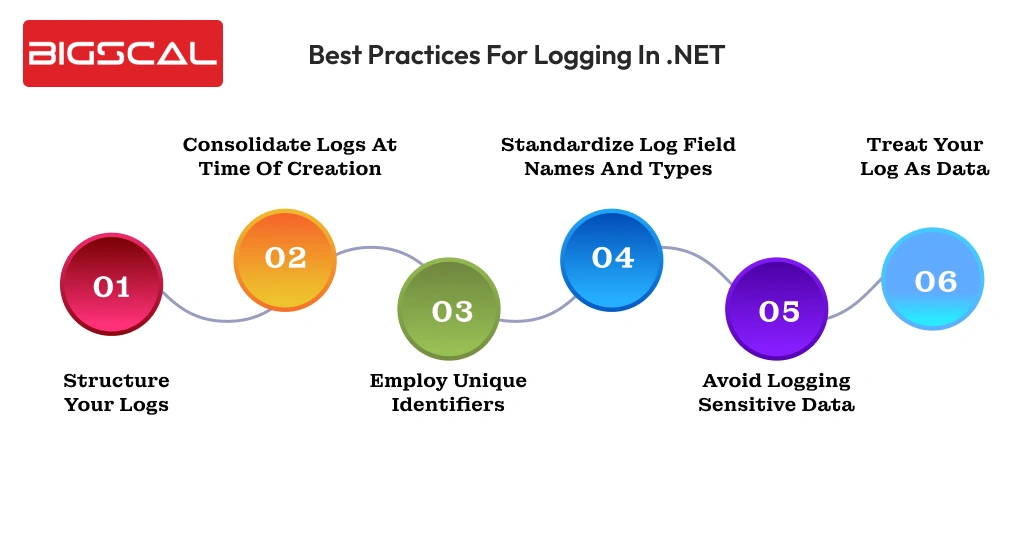
Here are best practices you must follow while logging in .NET:
Structure your logs
Having unstructured logs can cause problems for parsing, searching and analyzing. Hence use structured logs such as JSON and XML for processing logs in a programmatic manner, correlating them with others and employing them in monitoring and analyzing tools. These structured logs become easy to read and take actions upon. It ensures that development and operation teams can get to key information quickly.
Consolidate logs at time of creation
When you consolidate multiple related logs into a single event can cut down log volumes, enhance clarity and streamline the process of log analysis. Instead of logging each step individually with different processes, get together all relevant data such as status of actions, timestamps and other important details into a single structured log.
For instance if you are processing user login, it can encompass if the credentials were verified, time process has taken and outcome in a single log. As it is logged by the service it is sometimes also known as canonical log as it requests completely one request. It is problematic to encompass all information into one so create a trace span. Over the course of the work unit, you can add information.
Employ unique identifiers
You should develop a unique identifier where the request is from outside the system and encompass it in all processing that request causes. In an ideal scenario each service in the system provides one canonical log that is further linked to a unique identifier like request ID or trace ID. Hence this can debug complex problems faster and provide tracking for particular action requests or users throughout the system.
Standardize log field names and types
You must convert the logs into the standard Open Telemetry Model. Hence having standards names for fields and types across services can make sure searching, analyzing and correlating logs is easier. Without the consistent format logs might turn into fragmentation that leads to slower issues detection and additional complexity.
Avoid logging sensitive data
Make sure to keep in mind that logs must never contain sensitive information like passwords, card details or personally identifiable information. If you log these sensitive data it can eventually result in vulnerabilities or compliance violations. Hence ensure that this sensitive information is masked and excluded from logs or else manage it properly with a centralized logging system.
Treat your log as data
If you don’t conduct proper log analysis well structured logs too can become overwhelming and unmanageable. It also makes it difficult to recognize patterns, detect anomalies or track the root cause of the issue. As a result, you may utilize data like request IDs, user IDs, URL routes, or error codes to filter your logs. It can narrow down the list of logs for relevant entries making the troubleshooting process easier.
You can obtain application metrics, such as the frequency of API calls and their success rates by counting logs that depict user actions. Aggregating logs that contain request durations yields comprehensive latency statistics. It is because they are supported by the comprehensive log entries required to diagnose increased delay and debug faults. These application metrics are much more valuable than standard time-series aggregations.
Why is observability crucial in modern .NET applications?
Observability in modern .NET maintenance services is way beyond just monitoring. The process of monitoring only answers to the questions that “is everything alright?” while observability answers the question “Why is it wrong?” and even “what can happen next?” Hence this shift is critical for enterprises as it can lead to:
- Downtime costs: These outrages might result in businesses spending $5,600 per minute on an average as per Gartner.
- User Expectations: 53% of users end up abandoning apps that are slower and have lagging issues.
- Complex systems: Microservices, serverless functions and third-party APIs result in tangled workflows.
Hence observability ensures to help you have a lens into these issues for ensuring that the application works faster, is reliable and aligned with business goals.
Optimize your .NET applications
- Smarter logging and observability solutions
- Expert .NET support from us
Best practices for .NET observability
Let’s learn some best observability key practices to follow in .NET software development:
Concentrate on three pillars metrics, logs and traces
The three main methods of obtaining observability data are metrics, logs, and traces. Each of these plays their own role in your complete ability to inspect the state of the system:
- Metrics are a bunch of numerical values like CPU utilisation, latency and number of errors.
- Logs are text based messages that comprise of all key events in your application.
- Traces are a comprehensive analysis of the path of request through a system. As a result, it makes it easier for you to comprehend how each request moved between the call stack and microservices tiers.
Hence having a complete observability strategy means it has all of these three components. If it misses any one of these it can result in a visibility gap that can prevent you from achieving the aim.
Make sure to match your metrics with KPIs
Observability data is only helpful when it aligns with your business key performance indicators. Continuing to gather data that doesn’t align with your goals is pointless. It will only cause disturbance, full up space and add up costs.
Hence to decide on which metrics to collect you will first look for KPIs. For example if you need 99% availability, you can keep track of latency and error rates within the observability stack.
Metrics such as total number of requests doesn’t directly match with your aim so avoid including it. Linking these metrics to the KPIs enhances the chances that your observability investments provide actual results.
Check if the collected data is actionable
Though we have mentioned this already, it should not be forgotten that observability data is not very helpful when it cannot be used. Hence the response actions, like spinning up a service replica when the latency increases, should be actionable and obvious after studying data completely.
The metrics which are tangentially connected with your operating procedures, should not be measured as it can hide more important patterns. Displaying personalized views of the metrics and logs you have created is often useful, as the various stakeholders will require different data.
Hence when compliance teams are interested in the logs showing specific hazards, the operations teams may focus more on infrastructure metrics, instead of application-level traces. Filtering enhances the power of action of the consumer on the data.
Make observability data accessible
Observability data becomes a useful asset when it is a shared resource that anyone can gain access to. Siloing metrics and logs can restrict the stakeholders from having an eye on the bigger picture that results in misdiagnosis of issues.
On the other hand if the observability data is universally accessible the system lets contributors analyze how changes can affect workloads, components and overall outcomes.
Using observability platforms such as Grafana can let you centralize data access for better control and flexibility. They provide a platform to developers, operators and managers at a single place to gain visibility of the DevOps stack. In order to obtain a variety of viewpoints, it might also make data accessible to non-technical stakeholders.
Conclusion
Effective logging and strong .NET observability are necessary for creating reliable, scalable and high performing .NET applications. With the help of structured logging practices and combining logs with metrics and traces, teams can have better visibility into the behaviour of the system and faster root cause analysis.
When observability data aligns with the business goals and remains actionable, it transforms into a strategic advantage. Hence it helps .NET application to stay resilient, effective and ready for growth.
FAQ
What tools are best for monitoring .NET applications?
The best tools for monitoring .NET applications include Application Insights, OpenTelemetry, Grafana, Prometheus, and the ELK Stack, which together provide end-to-end .NET observability.
What is .NET observability?
.NET observability is the ability to understand an application’s behavior using logs, metrics, and traces to gain deep operational insights.
Why is logging important in .NET applications?
Logging plays a critical role in debugging, performance analysis, and identifying the root cause of application failures.
What are the built-in logging providers in .NET?
.NET includes built-in logging providers such as Console, Debug, EventLog, and EventSource.
What is structured logging in .NET?
Structured logging stores log data in structured formats like JSON or XML, making logs easier to search, filter, and analyze.
Why should logs be consolidated?
Log consolidation helps reduce noise, improves clarity, and simplifies troubleshooting across distributed systems.
Why should sensitive data be avoided in logs?
Logging sensitive data can lead to security risks and regulatory non-compliance, making it essential to sanitize logs.
What makes observability data actionable?
Observability data becomes actionable when it clearly indicates the cause of an issue and the steps needed to resolve it.
Why is centralized observability important?
Centralized observability improves visibility, enables better team collaboration, and speeds up issue resolution.
Why should observability metrics align with KPIs?
Aligning observability metrics with KPIs ensures monitoring efforts deliver measurable business value.

