
What is Exploratory Data Analysis?
Quick Summary: This blog delves into the intricacies of exploratory data analysis. It emphasizes the importance of EDA, explores different techniques, and provides practical examples to enhance understanding.
Introduction
In data science, understanding and analyzing a dataset can significantly impact your project’s success. Exploratory Data Analysis (EDA) empowers data scientists to identify data patterns and anomaly relationships within their data.
EDA helps businesses to make informed decisions and shape meaningful outcomes. Data analytics consulting firms leverage such data to make impactful decisions, employing advanced techniques to extract insights, forecast trends, and guide strategic actions that yield significant results.
In this comprehensive guide, we will understand the complexities of Exploratory Data Analysis highlighting its significance, techniques, and practical applications. Let’s get started!!!
What is Exploratory Data Analysis?
Exploratory Data Analysis is conducting initial investigations on data to find patterns, spot anomalies, test hypotheses, and check assumptions using statistics and graphical representations.
Data analysis using Python helps data scientists gain valuable insight into the structure and nature of their data, enabling them to formulate hypotheses and identify potential areas of investigation. Furthermore, EDA is more than just applying statistical techniques – it’s a creative, intuitive process requiring a keen eye for detail.
Types of EDA
EDA is of two types :
1. Univariate Analysis
The univariate analysis allows you to examine a single variable at a given time. Thus, univariate data analysis is the simplest type of analysis because only one quantity changes. Furthermore, in this analysis, the primary focus is on describing the data and finding patterns within it, without examining causes or relations
2. Bi-Variate analysis
It allows you to analyze two different variables at a time. Further, this type of data analysis involves finding relationships between variables and analyzing the causes of the relationships.
3. Multivariate Analysis
Multivariate analysis allows you to study and research three or more variables at a time.
Business Knowledge
One of the most essential parts of EDA or Feature Engineering is to Understand the business outcomes and their requirements. For that, you have to gather relevant survey data. It would help if you also did some research on the module.
There are two ways to do this: Primary and Secondary Research.
Primary Research :
Ask the questions and gather information from the stakeholders. If possible take a dry run of the problem you are trying to investigate.
Secondary research :
Read reports and studies by government agencies, trade associations, or other businesses in your industry. Go through any previous work and findings related to our problem.
Note: ” Quality of inputs decides the quality of modal output ”
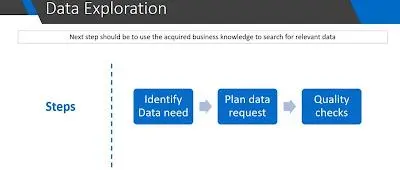
The next step should be to use the acquired business knowledge to search for relevant data.
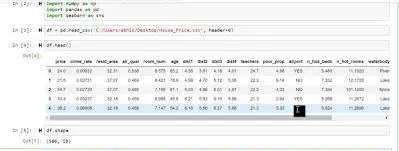
Now, let’s start with a real-life problem statement. Here, I am using the last properties transaction to predict future property capital.
So, here price is our dependent variable, and after researching primary and secondary ways which independent variable impacting our price of the property.
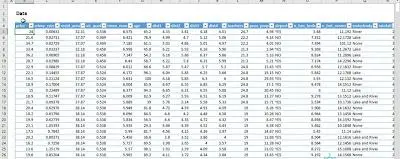
Import the data in juypter.
EDD
You have to do EDD ( EXTENDED DATA DICTIONARY ), such an observation helps you to find the presence of outliers, the presence of missing value so on.
Using df. describe(), df. shape() you’ll get all EDD analysis.
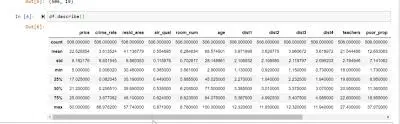
Observer the Univariant data all most all in the range 1 to -1.
Which pair hold negativity that means both columns are not affected by our dependent variable.
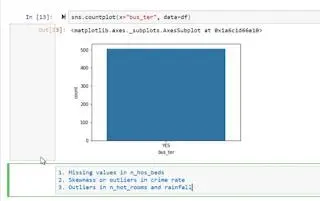
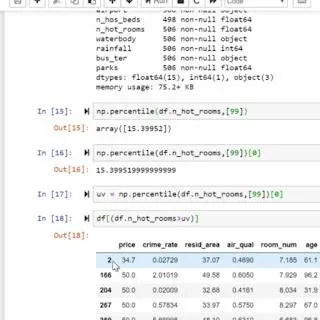
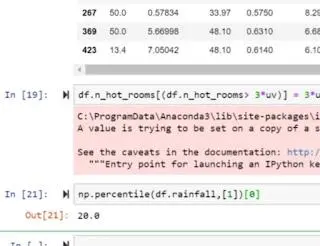
Attention: Here I cleaned the data by myself, I am sharing code in the following screenshots!
Lastly, to sum up, all Exploratory Data Analysis is a philosophical and an artistical approach to gauge every nuance from the data at the early encounter.
Key Objectives of EDA
1. Unveiling Data Patterns
Exploratory Data Analysis helps you in determining the hidden patterns you may not be aware of. Furthermore, a variety of graphs and plots are helpful in visualizing the data, revealing patterns such as trends, clusters, and distributions.
2. Detecting Anomalies
It is very important to consider anomalies, outliers, and inconsistencies within the data when analyzing the results of the analysis. Furthermore, EDA helps you to detect anomalies, allowing you to examine data quality issues in more depth.
3. Assessing Data Quality
It’s crucial to evaluate the quality of the data. By leveraging EDA, data scientists can recognize missing values, insufficient records, and other data quality problems.
Techniques for Effective EDA
1. Summary Statistics
Computing summary statistics is one of the fundamental techniques of exploratory data. Furthermore, with the help of these statistics, you can determine the crucial characteristics of the data, such as median, mean, mode, standard deviation, and range. These metrics help you to understand the data’s central tendency and variability.
2. Data Visualization
Data scientists can view and utilize the visual representation of data to make high-impact decisions. Furthermore, through visualization like graphs, histograms, sandbox plots, and scatter plots, data scientists can grasp the underlying structure of data and relationships between variables and identify outliers to make informed decisions based on their observations.
3. Correlation Analysis
It is crucial to get a comprehensive idea of the relationships between variables. Furthermore, correlation analysis measures how much and in which way numerical things are connected. It helps us understand how closely their value changes together and in what direction. Additionally, it helps you understand the relationships between variables and helps you make informed decisions in various fields.
Conclusion
This blog covers the essentials of exploratory data analysis. Read this blog to get valuable insights into understanding data patterns, identifying trends, and discovering hidden information. It is an excellent resource for businesses to make tangible, high-impact data-based decisions.
FAQ
Explain the exploratory data analysis definition.
EDA is a process of visually and statistically examining data to identify data patterns, relationships, and anomalies, aiding in understanding its underlying structure and potential insights.
Explain data exploratory analysis examples.
An example of exploratory data analysis includes analyzing a sales dataset through visualization and summary statistics to identify best-selling products, peak sales periods, and customer preferences.
Which tool is used for exploratory data analysis?
Python includes many tools for exploratory data analysis and visualization like matplotlib, pandas seaborn,dask, etc.
What are the different types of EDA?
There are three types of EDA: univariate, bivariate, and multivariate. In univariate EDA, a single variable is considered at a time. Furthermore, analyzing data in univariate form can help you identify outliers and understand data distributions.
Where is EDA used?
EDA is a method of analyzing datasets using visual methods to summarize their main characteristics in data mining. Before modeling, EDA is used to learn more about the data.

