
What is Data Analysis and Visualization using Python?
Quick Summary: These tutorials answered my questions on the basics of data analysis using Python. Readers are conferred with an appreciation of Python and its data exploration techniques and tools.
Introduction
Digital explosion has made data one of the most valuable assets for the businesses, helping to intepret the patterns and making the right decisions that bring in innovations across different sectors. Making sense of the raws data that is full of information and extracting (sifting and deciphering) the relevant stuff needs a lot of effort. Much the same, Python, instead of aligning with any other language, is the one that puts other languages to shame when it is time to do things in a fast and efficient manner.
Data analysis, converting the raw data into clear information, and visualization are key tools used for information of the enormous amount of data. The trusted Python development services incorporate the Exploratory Data Analysis part of this robust language, which uses various graphs to create applications that different industries utilize in understanding and presenting data
The article under consideration, ” Data Analysis in Python, ” will deconstruct the concepts, techniques, and instruments of data analysis in Python.
Let’s Discover with an example.
What Is Data Analysis?
Data analysis is a process of cleaning, altering, and modeling data for meaningful corporate decision-making information. Furthermore, Data analysis is useful in extracting meaningful information from data and making decisions based on that knowledge.
Why Python?
Why Python? We already said that Python is a widely used programming language. When it concerns data analysis, it isn’t the only option. However, it’s a great one. Another reason is that it is more commonly used! Python is simple to use and has a vast developer community to assist you with data analysis.
Furthermore, data analysis using Python is highly entertaining due to the large number of creative libraries for data analysis and visualization that it provides.
Pandas is the Python foundation library for data analysis. It’s a high-level library for scientific computing and numerical analysis based on the NumPy library. Furthermore, Pandas makes working with data easier by providing the DataFrame data structure.
DataFrame is a tool for reading and storing data.
Setup
The very first task is to determine where you plan to go. It’s crucial to have the appropriate place to store all of your work when doing data analysis in Python. Python data analysis will be more than just text; it will also be your link to the database, so you’ll need a solid working environment.
Anaconda Distribution provides that service in Python. The Jupyter notebook is Anaconda’s ideal workspace. Well, it allows you to have visuals in your notebook immediately.
It also has additional magical features that allow you to see the output without having to explicitly state where you want it.
Let’s understand by one example.
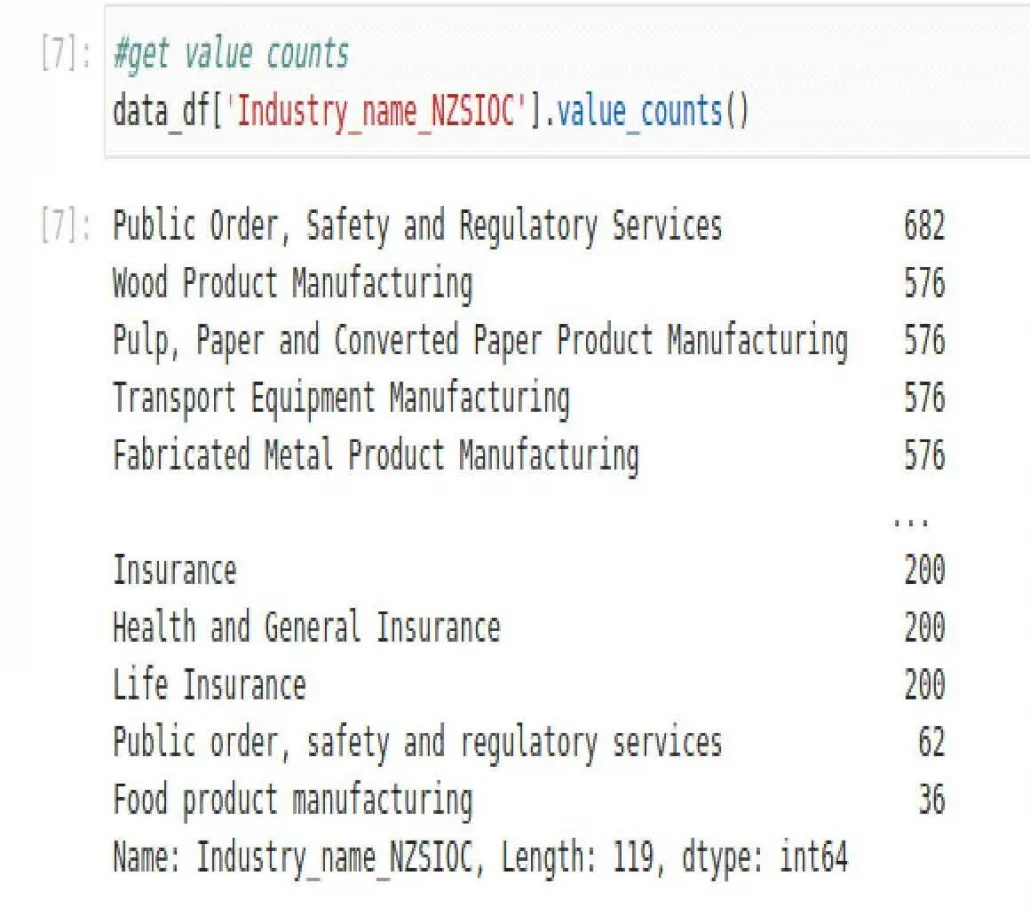
First, reading datasets. For loading the dataset into its fundamental data structure, Pandas provides certain basic operations: DataFrame. We can use it as follows.


What are Data Visualizations?
Data visualization is a process within the data science process that involves visualizing the data after the process of collection, processing, and modeling.
Additionally, it focuses on data presentation architecture (DPA) focuses on finding, modifying, preparing, and transferring data efficiently.
Why Python for Data Visualizations?
Python has several charting libraries, including Matplotlib, Seaborn, and several other data visualization tools, all of which have distinct features for constructing useful, personalized, and appealing plots to show data most simply and effectively possible.
Seaborn and Matplotlib
The python libraries Matplotlib and Seaborn are used for data visualization. They provide modules for plotting various graphs.
Seaborn is mostly used for statistical graphs, whereas Matplotlib is used to embed graphs into programs.
| Matplotlib | Seaborn |
|---|---|
| It’s used to make simple graphs like line charts and bar graphs. | It’s primarily used for statistics visualization, and it’s capable of performing sophisticated visualizations with fewer commands. |
| It works primarily with datasets and arrays. | It can handle entire datasets. |
| Matplotlib is a useful tool for working with data arrays and frames. It considers aces and figures to be objects. | Seaborn is far more organized and functional than Matplotlib because it treats the entire dataset as if it were a single entity. |
| For exploratory data analysis, Matplotlib is more customizable and interacts well with Pandas and Numpy. | Seaborn features a wider range of pre themes and is mostly used for data analysis. |
For instance, Let’s take a look at this with an example. Matplotlib and Seaborn, are two well-known Python visualization libraries.


Conclusion
This blog dives into Python database visualization area to show how Python libraries bring the users the capability to make dashboard visualizations taht represent the database insights in an understandable manner.
FAQ
How to use Python for data analysis?
Employ python data analysis libraries such as Pandas, and NumPy for data import, cleaning, manipulating and assembling of data as well as analysis.
Why visualize data with Python is crucial?
Data visulization with the help of Python is critical because through using visual its simple to understand the complex information. This capability in addition incubates the ability to identify trends, patterns, and aberrations that allows companies to come up with tangible decisions that cover different areas in their businesses.
What are the benefits of data analysis using Python?
With the libraries of Python for data analysts, inefficient operations on data are simplified done and the process advanced analytics and data visualized is easy to conduct.
What are the future trends of Python and data analytics?
The way ahead for python and data analytics comprise automation of AI-includes, integration with Big data platforms, and advanced machine learning capacities.
Which is best, Python or data analytics?
Python however, is capable of more than that, in terms of many functional tasks like data manipulation, web development as well as machine learning. This is another very helpful feature of R which is to help with visualization as well analysis.

